Chapter :- 5 Advance Features of Excel
Advance Features of Excel
Buzz Words
1. Chart: Graphical representation of data is known as charts.
2. Embedded Charts: When charts are on the same worksheet of the data, they are known as embedded charts
3.Goal Seek: Goal Seek function allows the user to use the desired result of a formula to find the possible input value necessary to achieve that result.
4. Data Consolidation: Merging of data from multiple worksheets is known as data consolidation,
Fill in the Blanks
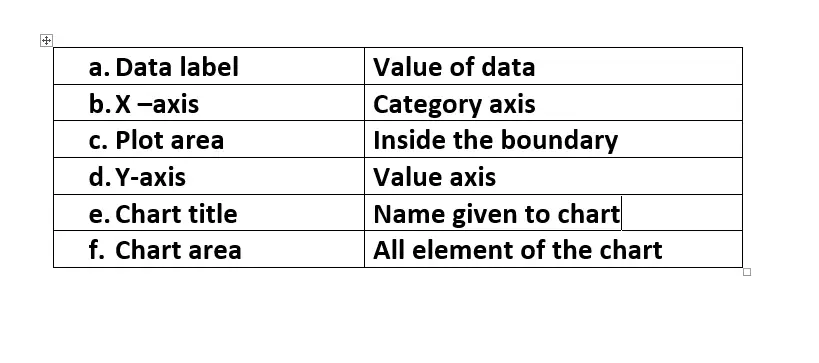
1. The chart area is the entire chart with all its elements.
2. The Y-axis is also known as the Value axis.
3. In Pie Chart, data is displayed in circular format.
4. When worksheets are grouped, the sheet tab changes to White colour.
5.The Consolidate option is present in the Data tool group under the tab.
6. Legend is a box that identifies the patterns or colours that are assigned to the data series or categories in a chart.
State Whether True or False
1.The X-axis is the vertical axis. False
2.We can make 3D charts in Excel. True
3.Scatter charts are also known as XY charts True
4.The position of the Legend cannot be changed. False
5.We can format the axis to change the intervals on the Y-axis. True
6.The Illustrations group is present on the Insert tab. True
Multiple Choice Question
1.The characteristics of an Excel chart are
(i)Charts can be 2D or 3D
(ii)Charts can be colourful
(iii)Charts pick up data from the rows and columns from the worksheet
(iv) All of the above
2. The charts in circular shape are
(i) Bar and Column
(ii) Pie and Bar
(iii) Pie and Doughnut
(iv) Doughnut and Scatter
3. The elements of the chart that can be formatted are
(i) Legend
(ii) Plot area
(iii)Chart area
(iv)All of the above
4.The options in the Illustrations group are
(i)ClipArt, Picture Screenshots
(ii)ClipArt, Chart, Picture
(iii) Clipart, Picture, Goal Seek
(iv)ClipArt, Goal Seek, Group sheets
5. The Fill option of the chart area provides with
(i)Solid fill
(ii) Gradient fill
(iii) Pattern fill
(iv) All of the above
Match the following

Answer briefly
1. What are embedded charts?
Ans :- When charts are on the same worksheet of the data, they are known as embedded charts.
2. What are Legends?
Ans :- The legend is a box that identifi es the patterns or colours that are assigned to the data series or categories in a chart.
3. How is Value axis different from Category axis?
Ans:- Value Axis contains data whereas Category axis contains categories.
4. What are Line charts?
Ans :- Line chart is formed with lines. A line is used to connect the data points to display the data at equal intervals.
5. How are Doughnut charts different from Pie charts?
Ans:- Doughnut can contain more than one data series, whereas a pie chart contains only one data series.
6. What changes happen when the Major Unit of the Y-axis is changed?
Ans :- Change in the Y-axis happens when the Major Unit of the Y-axis is changed.
Answer the following
1. Explain the components of an Excel chart.
Ans :- Chart Area, Data Series, Plot Area, X-axis, Y-Axis, Legend, Chart Title, Data Label
2. How are these charts implemented: Bar, Column, Line, Scatter?
Ans :- i. On the worksheet, arrange the data that you want to plot in a chart.
ii. Select the cells that contain the data that you want to use for the chart.
iii. On the Insert tab, in the charts group, do one of the following: Line, Bar, Column,
Scatter.
iv. Click the chart type and then click a chart subtype that you want to use.
v. See all available chart types as shown
Click to launch the Insert Chart dialog box.
vi. By default, the chart is placed on the worksheet as an embedded chart
3. What is the purpose of the Goal Seek function?
Ans :- The Goal Seek function allows the user to use the desired result of a formula to find the possible input value necessary to achieve that result. Suppose we have obtained a result of a calculation using formulas, but we desire a different result. With the help of Goal Seek function we start with the desired result, and it calculates the input value that will give us that result.
4. How does the Consolidate function help?
Ans :- Consolidating data refers to merging of data. Excel helps to combine or merge data present in different Excel worksheets.


Popular Videos

UX for Teams
Learn the basics and a bit beyond to improve your backend dev skills.

Designer

SEO & Instagram
Learn the basics and a bit beyond to improve your backend dev skills.

Designer