Solution :-
import pandas as pd
sales = {‘InvoiceNo’: [1001,1002,1903,1004,1085,1006,1007],
‘ProductName’: [‘LCD’,’AC’,’Deodrant’,’leans’,’Books’,’Shoes’,’Jacket’],
‘Quantity’: [2,1,2,1,2,1,1],
‘Price’:[65000,55000,500,3000,958,3000,2200]}
df=pd.DataFrame(sales)
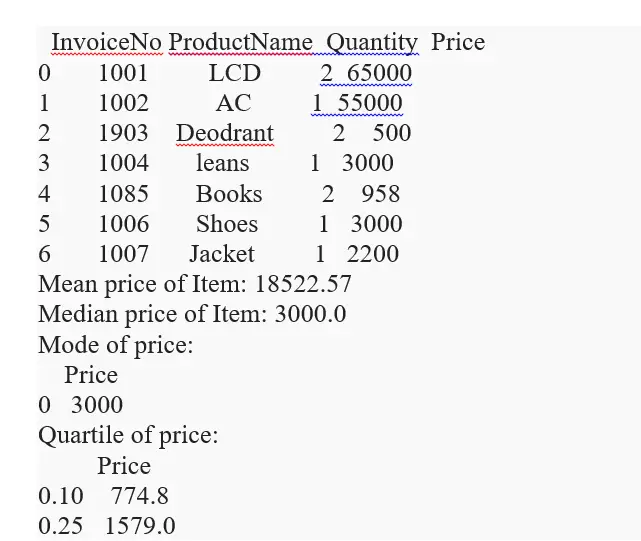
print(df)
print(“Mean price of Item:”, df[‘Price’]. mean ().round (2))
print(“Median price of Item:”, df[‘Price’]. median ().round (2))
print(“Mode of price:\n”, df[[‘Price’]]. mode ())
print(“Quartile of price:\n”,df[[‘Price’]].quantile([.1,.25,.5,.75],axis=0))
print(“Variance of Price:\n”,df[[‘Price’]].var())